

Creating a clear process diagram can seem daunting, especially with the many options and tools available.
But imagine for a moment that you could visualize every step of your workflow, from the first task to the final decision.
Indeed, a well-designed diagram helps to:
- clarify roles,
- optimize actions,
- and above all, improve communication within your team.
In this article, you will discover how to use different types of diagrams to model your processes, from the flowchart to BPMN.
We will explain how to choose the right software and how to integrate visual elements, such as connectors and icons, for a more accurate graphical representation.
Thus, at each step, you will learn to create diagrams that reflect the reality of your business, from bottlenecks to opportunities for continuous improvement.
By the end of this article, you will know how to structure your processes to maximize productivity while facilitating decision-making.
Ready to take your process diagrams to the next level?
Let's dive into the guide together!
1) Step 1: the basics of the process diagram
a) Definition and types of process diagrams
What is a process diagram?
A process diagram is a visual representation that describes the steps of a business process or a workflow.
It helps to visualize:
- activities,
- workflows,
- decisions
- and interactions within a system.
Indeed, by illustrating the links between different tasks, these flowcharts make complex operations easier to understand.
b) How to choose the right type of diagram and their applications
Process diagrams are not all the same, as each has its purpose and adapts to specific needs.
Here are the main types:
1) Process flow diagrams
Designed to describe the successive steps of a process, these diagrams illustrate the flows of information or products between steps using arrows and symbols.
They are particularly suitable for linear processes, where each step depends on the previous one.
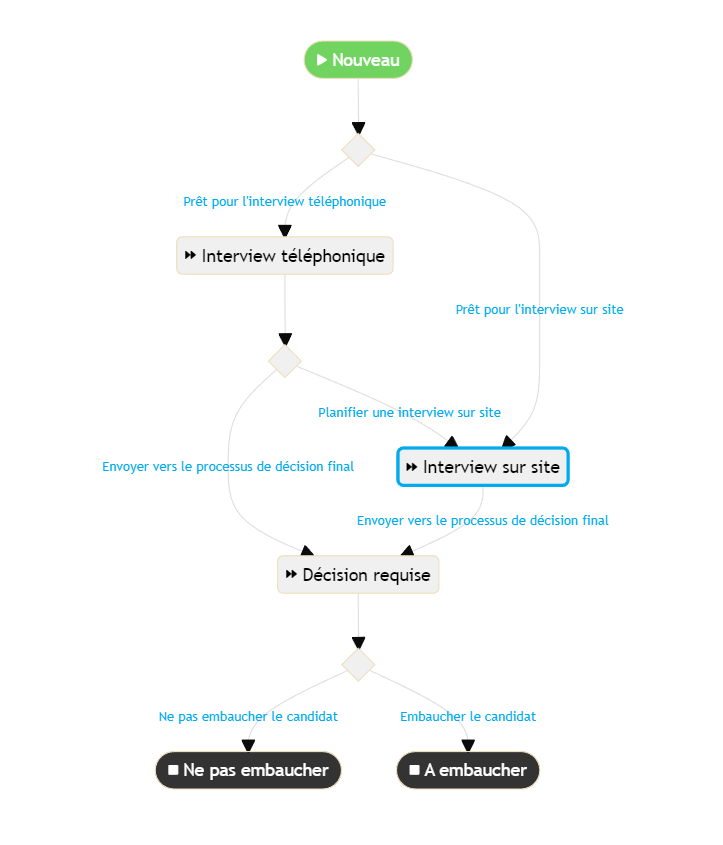
2) Flowcharts
They make it easier to visualize complex decisions by using standardized geometric shapes, such as rectangles for actions and diamonds for decisions.
This type of diagram is useful for representing different options and their consequences within a process.
3) BPMN (Business Process Model and Notation)
This notation, more advanced, is mainly used by analysts and business process experts.
It allows precise representation of activities, events and associated rules.
It is particularly suited to complex processes that require extensive documentation.
4) Gantt charts
These tools are used to plan and manage the time allocated to different tasks of a project.
They allow visualizing dependencies between steps and tracking project progress.
They are especially suitable for project management and task organization.
5) UML diagrams (Unified Modeling Language)
These diagrams, mainly used in software development, allow detailing interactions between systems, objects and components.
They prove essential for technical projects that require a detailed understanding of relationships between stakeholders.
6) Comparative table of process diagram types
Diagram Type | Characteristics | Applications | Benefits |
Process flow diagram | Sequential, linear, uses arrows | Visualize the steps of a simple process | Simplicity, easy to read |
Flowchart | Complex decisions, geometric symbols | Mapping choices and consequences | Flexibility, clarity for decisions |
BPMN | Standardized, precise notation | Complex business processes | Precision, international standardization |
Gantt chart | Time bars, dependencies | Project management, scheduling | Time tracking, project management |
UML | Modeling interactions | Software development, complex systems | Detail, technical clarity |
c) What symbols are used in a process diagram?
Each process diagram is based on a set of standardized symbols and each of them plays a role in the visual understanding of steps and decisions.
1) Here are the main symbols found in most diagrams
Symbol | Description | Usage |
Oval | Start or end of a process | Indicates the starting point and the conclusion of a process flow. |
Rectangle | Specific action or step | Represents a task or activity to be performed. |
Diamond | Decision | Shows a decision point, with arrows indicating the different options or possible paths. |
Arrow | Direction of flow | Indicates the direction of the process, linking the steps together to show the logical sequence. |
Circle | Connection point | Used to connect parts of the diagram, often for long or complex processes. |
Rounded rectangle | Document or report | Represents a document produced or required at a step in the process. |
Parallelogram | Data input or output | Indicates incoming or outgoing data in the process. |
Hexagon | Preparation | Indicates a preparation step required before starting a specific task. |
When used correctly, these symbols allow you to:
- quickly visualize the important steps of a process,
- critical decisions
- and the overall direction of the flow.
2) Using colors and styles to emphasize information
Using varied colors allows you to categorize information, draw attention to specific points, and make the diagram easier to interpret.
- Use of colors to categorize: for example, bright colors like red or orange can indicate critical steps or high-risk decisions, while green can be used to indicate completed tasks or positive points.
- Differentiating line styles: dashed lines or zigzag arrows can represent interrupted processes or optional steps. Thick, straight arrows, on the other hand, indicate a main or priority flow.
- Filled or empty symbols: a filled rectangle can mean an active ongoing task, while an empty rectangle might represent a future step or a pending task.
2) Step 2: preparing to create your process diagram
a) identifying objectives and the target audience
Before creating a process diagram, you must clarify its objectives and define the target audience.
To help you get a clearer view, first answer the two questions below.
- Why design this diagram?
- Who is it really intended for?
These two questions may seem simple, but they are the key to a solid and sensible graphical representation.
The purpose of the diagram can vary, as it may:
- Serve to document a complex process.
- Train new employees.
- Identify potential improvements.
- Or communicate a workflow to a team.
That is why you must clearly know the diagram's objective because it matters for:
- Determining the level of detail.
- The type of diagram to use.
- The information to include.
As for the target audience, it may include:
- Managers.
- Employees.
- Customers.
- Or partners.
The level of understanding and the specific needs of each group will dictate how the diagram should be designed.
A diagram intended for operational teams, for example, will require more detailed information than one designed for external partners looking for an overall overview.
b) Questions to ask to define the purpose of the diagram
Here are some questions that help clarify the objective and target audience of a process diagram:
- What is the main problem or need that this diagram should solve?
- Who will use this diagram daily?
- What is their prior knowledge of the process?
- Should the diagram provide an overview or detail each step of the process?
- Do you want to emphasize key decisions, specific tasks, or data flows?
- What critical information must the diagram absolutely represent?
- Are there specific constraints (time, resources, skills) to consider when creating the diagram?
- How will the diagram be used?
- Will it be displayed in a document, on an online platform, or in a presentation?
These questions help define the scope of your diagram more clearly and avoid common mistakes, such as including unnecessary details or omitting information.
c) Collecting the necessary information
This part identifies all the steps, tasks, decisions and interactions involved in the process to be mapped.
Without this data, the diagram may lack clarity or fail to accurately reflect on-the-ground reality.
Thus, your information collection will take place in several stages.
- First, you need to identify the key actors involved in the process: who are the people or teams concerned?
- Then, you must gather all the data on inputs, outputs and decision points.
List of techniques for collecting data
Technique | Description | Practical Tips |
Interviews | Discussions with process stakeholders to obtain detailed information and varied perspectives. | Prepare a structured interview guide, ask open and specific questions, record answers for later analysis. |
Observation | Direct observation of the process in action on the ground to see how it is actually executed. | Note gaps between theory and practice, identify adjustments made by employees, document actual workflows. |
Documentation analysis | Review existing documents (manuals, internal policies, reports, etc.) to understand the theoretical framework of the process. | Compile all relevant documents, extract key information about steps, responsibilities and resources. |
3) Step 3: how to create a process diagram?
How to create a process diagram, your 2024 guide.
a) Define the process boundaries
The first step to creating a process diagram is to clearly define its boundaries.
This means establishing the frame of your diagram:
- What are the start and end points?
- What inputs (resources, information, materials) enter the process?
- What outputs (finished products, services, results) come out?
1) Identify the start and end points
The start point corresponds to the event or input that triggers the process.
This can be:
- A customer order.
- An internal request.
- Or the arrival of new information…
The end point, on the other hand, is the desired final result, such as:
- The delivery of a product.
- The completion of a report.
- Or the closure of a file.
These points are the foundation of your project, as they determine the scope of the diagram and prevent representing unnecessary steps that are not actually part of the process to be modeled.
2) Determine the main inputs and outputs
Once the boundaries are defined, you must identify the inputs needed to start and run the process.
Inputs can be:
- Data.
- Human resources.
- Equipment.
- Or critical information…
Similarly, the outputs must be clarified:
- What are the finished products?
- What are the expected results of this process?
This step ensures that the diagram will cover all the information and resources necessary for the process to operate correctly.
b) Sequencing activities and tasks
Once the process boundaries are defined, it's time to structure activities and tasks in a logical and smooth manner.
Sequencing activities is the step where you determine the order in which tasks should be performed.
However, keep in mind that the workflow must always be clear and coherent.
How to organize tasks logically and smoothly
To properly organize tasks, follow these principles:
- Identify main tasks: start by listing all the steps required to execute the process, from the initial input to the final result. Make sure to include every detail, including small intermediate tasks.
- Determine dependencies: identify tasks that require other activities to be completed before they can start. For example, an approval step must necessarily come after the creation of a document. Ensure that each task is positioned coherently in the flow.
- Prioritize critical activities: some process steps are more important than others. For instance, validation before a production phase is decisive. Prioritize these activities to reduce errors and optimize process flow.
- Avoid bottlenecks: identify process steps that could slow down the workflow (such as approvals or verifications). Think of ways to simplify or speed up these steps to avoid blockages.
- Maintain a continuous flow: tasks should be connected by clear transitions (use of arrows) to show how information or products move from one step to another without interruption. Ensure that each step naturally leads to the next, without confusion.
c) Validation and optimization of the diagram
Once the process diagram is created, you must validate and optimize it.
Indeed, this step ensures that the diagram accurately reflects the reality of the process and identifies improvement opportunities.
Now, let's review:
- Methods to have the diagram validated by stakeholders.
- Identifying potential problems.
- Applying optimization techniques.
1) Validation by stakeholders
Validating the diagram ensures that the diagram is both accurate and useful.
Stakeholders can include operational teams, managers, internal customers, or any other group concerned with the process.
Here's how to proceed:
- Present the diagram to stakeholders: organize a meeting or workshop to present the process diagram. Provide clear visual support, such as a projector or screen sharing, so that each stakeholder can examine the diagram in detail.
- Ask for comments and feedback: encourage stakeholders to give their feedback. Ask direct questions to clarify points of uncertainty or to find out if important steps are missing. Use collaborative tools like digital whiteboards or shared documents to collect feedback in real time.
- Revise the diagram: based on the comments received, adjust the diagram. Make sure that all changes are approved by the relevant parties to ensure consensus.
2) How to identify and resolve issues in the process
To improve the diagram, you must spot potential issues that could affect the workflow.
Here are some methods to achieve this:
- Bottleneck analysis: examine the diagram to identify steps where the workflow slows down or stops. These bottlenecks can be due to late approvals, redundant tasks or insufficient resources.
- Review critical decisions: check decision points in the diagram (symbolized by diamonds). Ensure that all possible options and their consequences are properly represented. Also check that decisions do not create confusion or unnecessary delays.
- Observe performance gaps: compare the diagram with real performance data. If some steps take more time than expected or require more resources, adjust the diagram to better reflect reality.
3) Diagram optimization techniques
After identifying issues, here are techniques to optimize your process diagram:
- Simplification: reduce the number of steps to the strict minimum necessary. Remove redundant tasks and combine those that can be executed in parallel.
- Automation: integrate automated tools or systems where possible to reduce human errors, speed up the workflow, and free up time for higher-value tasks.
- Standardization: adopt standards and protocols for recurring tasks to ensure consistency and reduce variation in process execution.
- Resource optimization: reassess the allocation of resources (human, material, financial) to ensure they are used optimally and do not create bottlenecks.
4) Step 4: use and update your process diagram
a) How to effectively communicate a process diagram?
Once your process diagram is validated and optimized, it becomes a valuable tool for training and internal communication.
When used well, you can not only clarify the steps of a process but also strengthen teams' understanding and buy-in.
Here is how to get the most out of your diagram for these goals.
1) Use the diagram for training and internal communication
The process diagram can serve as:
- Training material during training sessions.
- Onboarding of new employees.
- Or for team meetings.
It allows you to visualize key steps quickly, show how tasks are interconnected and illustrate the workflow.
As a result, employees can more easily absorb complex information and understand their role within the process.
Here is how to use the diagram optimally:
- Integrate the diagram into training materials: add it to PowerPoint presentations, user manuals or training documents. Use it to explain each step of the process during training sessions.
- Host interactive workshops: encourage employees to analyze the diagram in groups, ask questions and propose improvement suggestions. This boosts engagement and ensures everyone understands the process.
- Use the diagram as a reference tool: display it in common areas or on internal digital platforms so employees can easily refer to it if they have doubts or need guidance.
2) Tips to make the diagram easily understandable by everyone
For the diagram to be a solid communication tool, it must be clear and accessible to everyone, regardless of skill level or role.
Here are some tips to improve its readability:
- Simplify the content: use simple terms and avoid technical jargon. Each step of the process should be explained concisely so that everyone can understand it quickly.
- Use consistent colors and symbols: apply uniform colors and symbol styles throughout the diagram. Colors can help categorize steps, and symbols should be standardized to avoid confusion.
- Add legends and annotations: include legends to explain specific symbols or terms. Annotations can also clarify certain steps or provide additional details, especially for complex tasks.
- Optimize size and layout: ensure the diagram is readable whether printed or displayed on a screen. Use an appropriate font size and avoid overloading the diagram with too much information.
- Test the diagram with a sample of users: before rolling it out widely, test it with a representative group of users to check its clarity. Take their feedback into account to make adjustments if necessary.
b) How to optimize an existing process?
Once your process diagram is in place and used for training and communication, you must not consider it a fixed document.
Regularly updating the diagram ensures it always reflects your company's reality and supports continuous improvement.
1) Why and how to regularly update your diagram
Why update your diagram?
Company processes constantly evolve in response to internal and external changes:
- New tools.
- Reorganizations.
- Employee feedback.
- Market changes.
- Or new regulatory standards.
Therefore, a process diagram that is not regularly updated can quickly become obsolete, mislead teams and compromise operational efficiency.
Thus, updating the diagram allows you to:
- Ensure relevance and accuracy: an up-to-date diagram reflects current practices and recent adaptations, helping to avoid errors and misunderstandings.
- Improve employee engagement: employees feel more involved when work tools, such as process diagrams, align with their daily reality.
- Facilitate adaptation to changes: keeping the diagram up to date prepares your teams to manage upcoming changes more easily.
2) How to update your diagram
- Schedule regular reviews: plan periodic reviews (monthly, quarterly or semi-annually) to check the relevance of your diagram. Involve stakeholders and concerned teams to gather their feedback.
- Set up a feedback system: encourage employees to report any discrepancy between the diagram and reality. Use collaborative tools, such as forms online or discussion platforms, to facilitate continuous feedback collection.
- Assign clear responsibilities: designate a person or team responsible for updating diagrams. This person should be in contact with process owners and have a good understanding of company objectives.
- Document changes: with each update, clearly document the modifications made and the reasons for these adjustments. This facilitates tracking changes and reinforces transparency.
2) Introduction to continuous improvement and the Kaizen method
Continuous improvement consists of gradually optimizing the company's processes to reach higher performance levels.
The Kaizen method, which means "change for the better" in Japanese, is one of the best-known approaches to establish a culture of continuous improvement.
The method is based on several key principles:
- Small frequent changes: rather than seeking radical transformations, Kaizen advocates making small regular improvements. These incremental adjustments lead to substantial gains over the long term.
- Involvement of all levels: everyone, from leaders to frontline employees, is encouraged to contribute ideas to improve processes.
- Problem analysis and resolution: by identifying bottlenecks, malfunctions and errors in processes, Kaizen encourages a proactive approach to solve problems before they become critical.
5) What tools to use to create a process diagram?
8 reasons to use AirProcess in your project
1) A powerful and flexible no-code platform
Creating an effective process diagram can quickly become complex if you don't have the right tools.
With AirProcess, you benefit from a no-code platform that allows you to create your workflows in minutes, without any technical knowledge.
Imagine being able to model, modify and optimize your business processes without writing a single line of code, and without even having to draw the diagram, because it will generate itself!
The flexibility offered by AirProcess guarantees you a tailored tool, perfectly suited to your needs.
2) Create custom workflows for maximum optimization
Every company is unique, and your processes are no exception.
AirProcess allows you to customize your workflows by defining steps, actors and possible decisions in a few clicks.
Thanks to an intuitive interface and an integrated form editor, you can easily adapt your process diagrams to the evolution of your business.
3) Collaborate effectively with your teams thanks to innovative features
Collaboration is essential in process management.
With AirProcess, you get a platform that facilitates instant collaboration.
Use custom views to organize your team's work, configure columns, filter data, sort and group information according to your preferences.
Thanks to real-time access and flexible visualization options (navigation bar, tabs), each user can access only the information that concerns them, enabling smooth and structured process management.
4) Use flexible forms for precise data collection
A good process diagram relies on accurate and well-structured data.
For this, AirProcess offers you 21 field types for your forms, adapted to all your requirements:
- text,
- number,
- date,
- time,
- paragraph,
- and even fields automatically generated by artificial intelligence.
You can also use dropdowns, checkboxes, progress bars, attachments and much more to capture all necessary information and easily integrate it into your custom workflows.
5) Continuous improvement thanks to a scalable and adaptable platform
One of the pillars of continuous improvement is the ability to adjust and improve your processes based on feedback.
AirProcess makes constant updating and customization of your process diagrams easy, ensuring they remain aligned with your company's objectives at all times.
Moreover, with configurable views and filters, you can easily identify bottlenecks and optimize your processes.
6) Integrated communication and training tools for easy deployment
AirProcess is not only a platform for creating process diagrams, it is also a powerful tool for communication and training.
Use your workflows and diagrams to train your teams and simplify internal communication.
With annotation and customization features, you can adapt your diagrams so they are understandable by everyone, regardless of their level of process knowledge.
7) Cost reduction and quick return on investment
Unlike other solutions on the market that can be expensive, AirProcess offers competitive, tiered pricing starting at just €11 per user per month, with unlimited features and a 14-day free trial.
Large companies already use it daily and benefit from a maximum ROI, as 95% of users who adopt the platform use it for several years.
8) Try AirProcess and discover its superpowers
Don't just read about it—see for yourself how AirProcess can transform your process management.
Book a free demo now and let us show you how to create powerful and customized workflows for your business.
In just 20 minutes, we will show you everything you can achieve with AirProcess!
6) How to integrate artificial intelligence (AI) to optimize creation and updating of process diagrams?
Artificial intelligence is revolutionizing how companies model and manage their business processes.
It enables going beyond simple diagram creation to offer dynamic and continuous optimization.
But how can you use AI to make your process diagrams more relevant and effective?
Here are some avenues.
a) Using AI to analyze existing processes
AI excels at analyzing large amounts of data.
It can examine your company's current processes and automatically identify steps that slow down the workflow.
For example, AI can spot redundant steps that do not add value, or identify bottlenecks where a task takes longer than expected.
AI can also highlight improvement opportunities by analyzing historical performance data.
By integrating machine learning algorithms, it becomes possible to predict friction points before they occur and adapt processes accordingly.
b) Tangible results with AirProcess and its AI fields
AirProcess, with its integrated AI fields, perfectly illustrates how artificial intelligence can enrich the creation of process diagrams.
With AirProcess, you can:
- Automatically generate content for your processes using AI text fields.
- Quickly analyze collected data via flexible forms and get instant recommendations.
- Automate process updates based on real-time data for continuous, optimized tracking.
7) How to measure the effectiveness and impact of a process diagram on company performance?
A well-designed process diagram is fundamental, but how do you know if it really achieves its goals?
To find out, you need to measure its impact on company performance.
Several key performance indicators (KPIs) can be used to assess this impact.
Additionally, tools and tracking methods allow continuous measurement of the effect of process changes.
Here's how to proceed.
a) Key performance indicators (KPIs) to monitor
To measure the performance of a process diagram, several KPIs can be tracked:
- Execution time: the time required to complete a task or set of tasks in the process. By analyzing this KPI, you can identify steps that take longer than expected and adjust the process to optimize them.
- Error rate: the percentage of errors or incidents in process execution. A high error rate may indicate poorly defined steps or unclear workflows. Reducing this rate improves result quality and process reliability.
- Employee satisfaction: measure the satisfaction level of employees who use the process diagram. A well-designed process facilitates daily work and increases team engagement. Use surveys or regular feedback to track this indicator.
- Customer retention rate: the impact of the process on customer loyalty. A smooth and efficient process improves the customer experience, which can translate into better retention rates.
- Costs associated with the process: track costs related to process execution, such as resources used, time spent and any error correction fees. A decrease in costs is a positive sign of an optimized process.
b) Tools and methods to track processes
To continuously measure the impact of process changes, here are some tools and methods:
- Process management dashboards: use interactive dashboards to visualize KPIs in real time and monitor your process performance.
- Workflow management tools: platforms like AirProcess offer process tracking features that record and analyze all changes. You can thus measure the impact of adjustments on process performance directly from your management interface.
- Data analysis methods: collect and analyze data using Business Intelligence (BI) tools to identify trends and anomalies in process execution. This method helps understand how different process steps influence outcomes.
- Real-time feedback: implement a real-time feedback system to gather employees' opinions on process effectiveness. Use quick surveys or rating systems to obtain qualitative data that complements your KPIs.
8) Designing process diagrams adapted to hybrid work environments and remote work
The shift to hybrid work environments and remote work poses new challenges for process mapping.
How can you ensure every team member, whether in the office or remote, follows the same workflow and contributes effectively?
Here's how to design diagrams that adapt to these new realities.
a) How to map processes including remote collaborators or distributed teams
To integrate remote collaborators into your processes, it is important to map workflows taking into account geographic dispersion and communication constraints.
Here are some principles to achieve this:
- Clarify roles and responsibilities: clearly identify who is responsible for each task or step in the process, specifying on-site and remote collaborators. Use distinct symbols or colors in your diagrams to represent these different teams.
- Define synchronization points: in hybrid work environments, schedule synchronization moments such as virtual meetings or regular touchpoints. Include these elements in your diagram to indicate when and how teams should coordinate.
- Map communication flows: ensure the diagram includes all necessary communication channels (emails, instant messaging platforms, video calls) and the steps where these exchanges should occur. This helps avoid information loss and maintain consistency in the process.
b) Using collaborative tools to create and manage process diagrams in real time in a remote work context
Collaborative tools are major assets for managing processes with hybrid teams.
Here's how to use them to create and maintain your process diagrams:
- Online collaboration platforms: tools like AirProcess allow creating process diagrams accessible in real time to all team members, regardless of location. These platforms offer co-editing, commenting and change tracking features, which make updating processes simple and transparent.
- Use integrations and automations: integrate your process diagrams with other collaboration tools your team already uses (like Slack, Microsoft Teams, or Asana). This facilitates task tracking, automation of notifications and reminders, and ensures all collaborators are informed of process changes.
- Real-time sharing and visualization: use tools that allow sharing diagrams in real time and visualizing each member's contributions. These features foster greater transparency and a better understanding of the process by the whole team, even remotely.
c) Practical cases of processes specific to hybrid work environments
Here are some examples of processes that require an approach adapted to hybrid environments:
- Recruitment process: remote recruitment introduces new steps, such as online interviews, remote tests, and virtual reference checks. A process diagram for hybrid recruitment should include these elements, as well as coordination points between remote and on-site recruiters.
- New employee onboarding: in a hybrid context, onboarding new hires should include online training steps, virtual welcome sessions, and regular contacts with remote and on-site teams. The onboarding process diagram should integrate these elements to ensure a consistent experience regardless of the new employee's location.
- Remote project management: projects carried out by distributed teams require rigorous coordination. An adapted process diagram should include virtual project milestones, shared task management tools, and regular review points by video conferencing to monitor progress and adjust objectives in real time.
9) Conclusion
In this article, we explored in depth the steps to create an effective process diagram.
We began by defining what a process diagram is and the different available types, such as flow diagrams, flowcharts, and BPMN, each with its own applications and benefits.
We also discussed the importance of using performance indicators to measure the impact of these diagrams on company performance, as well as the tools and methods to track them continuously.
Finally, we addressed aspects such as integrating artificial intelligence to optimize processes and adapting diagrams to hybrid work environments and remote work.
Would you like to deepen your knowledge and discover more methods to optimize your business processes?
Explore our other articles on process management, BPM tools, and the use of artificial intelligence to transform your workflows.